

Linux server monitoring tracks what happens inside a machine: CPU, memory, disk space, load, network traffic and the services that must stay running. With AllInOneMonitor you install a small read-only agent with one command; it sends a sample every minute over HTTPS, and you get an alert when a value stays over its threshold, a service stops or the server goes silent.
Key takeaways
- External checks tell you a site is down; an agent tells you why: a full disk, exhausted memory or a stopped service.
- The agent is outbound-only and read-only: no open port, no remote shell, and it never runs commands from the platform.
- Installation is one line as root; a one-time token registers the server and then becomes useless.
- Threshold alerts fire only after a value stays over the line for several samples in a row, which keeps short spikes quiet.
- Collectors for databases, web servers, Docker and more switch on automatically when their tools exist on the host.
Why an agent, and not just external checks?
An HTTP check from outside answers one question: does the site respond? It cannot see the disk filling up at 2% a day, the memory leak that will crash PHP-FPM tonight or the backup service that stopped last week. Those problems show up inside the machine first, often hours or days before visitors notice anything. A server agent closes that gap. Combine both and you get the full picture: the external check says something is wrong, the server page shows what.
What the Linux agent collects
The agent is a plain bash script that needs only bash, coreutils and curl. Each collector runs only when its tool or file exists on the host and reports nothing otherwise, so no value is guessed.
| Area | What you see |
|---|---|
| CPU | Total usage, usage per core, core count and model |
| Memory and swap | Total, used, available and cached memory; swap used |
| Load | 1, 5 and 15 minute load averages |
| Disks | Per mount point: size, used, percentage and inode usage; disk read and write rates |
| Network | Per interface: traffic in and out, link state, speed, errors and drops |
| Processes | The top 15 processes by CPU, with memory |
| Services | The systemd services you list: active, inactive or failed |
| Extras when present | Docker containers, SMART disk health, mdadm RAID, CPU temperature, pending updates and reboot required, firewall tools, MySQL, PostgreSQL, MongoDB, Redis, Memcached, nginx/Apache/LiteSpeed status, PHP-FPM pools, mail queues |
The full list, with the exact source of every figure, is in the servers documentation. Database collectors read their credentials from a root-only file on the server itself; the platform never stores database passwords. More on that in our guide to MySQL and Redis monitoring.
Install the monitoring agent on Ubuntu (or any Linux)
The same command works on Debian, Ubuntu, AlmaLinux, Rocky Linux, CloudLinux and cPanel servers.
- Open Servers and click Add server.
- Give the server a Name ("web-01"), and optionally a location, provider, server type, group and tags.
- Under Agent, keep Report every (seconds) at 60 unless you need finer detail (30 to 600 seconds is allowed). List the systemd units to watch in Services to watch, one per line:
nginx,mysql,php8.3-fpm. - Review the Thresholds (the defaults are a reasonable start) and tick the Alert channels, or leave them empty to use the organisation's default channels.
- Click Add server. The server page opens with an Install the agent card that contains the install command with a one-time registration token.
- Copy the Linux command and run it on the server as root. It looks like this:
curl -fsSL https://your-monitor.example/api/agent/install.sh | sudo bash -s -- REGISTER_TOKEN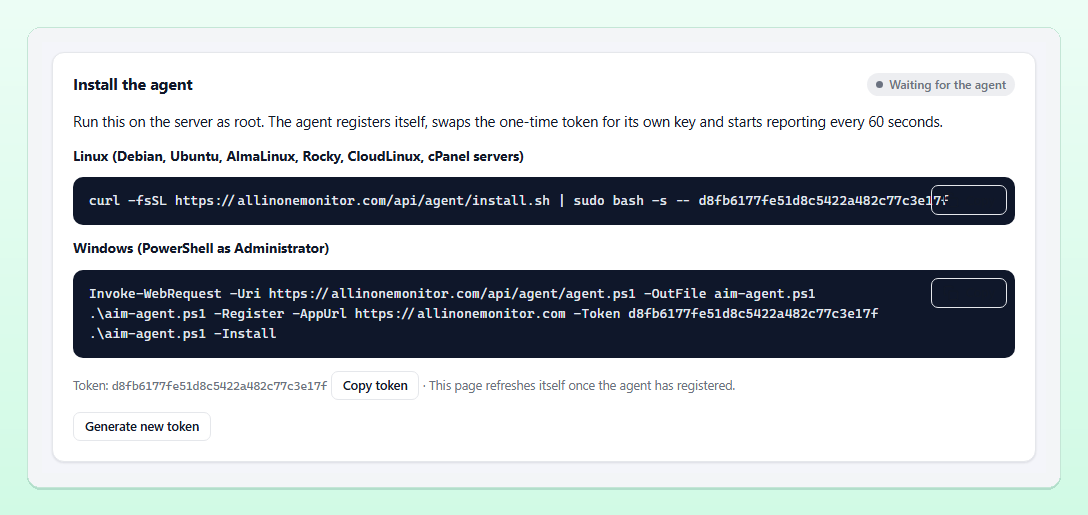
The installer downloads the agent to /usr/local/bin/aim-agent, registers it, writes its configuration to /etc/aim-agent/agent.conf (readable by root only) and starts the systemd unit aim-agent.service. On a machine without systemd it adds a cron line instead. The first sample arrives within a minute, and the server page refreshes itself once the agent has registered.
Tip: The registration token is shown only once. If you close the page before running the command, click Generate new token on the server page to get a fresh command; the old one stops working.
Useful agent commands
aim-agent status      # app URL, version, local settings file, spool size
aim-agent collect     # print one sample: exactly what would be sent
aim-agent run         # send one sample now
systemctl status aim-agent
journalctl -u aim-agent
aim-agent collect is worth running once: it prints the exact JSON that leaves the machine, so you can see for yourself what is and is not collected.
Security: what the agent will never do
- Outbound only. It makes HTTPS requests to the platform. No inbound port, no SSH access, no remote shell.
- Read-only. It never executes anything sent by the platform. From the answers it reads only settings such as the interval, the service names to check and the paused flag.
- Secrets stay local. Its token and update key live in root-only files; on the platform the token is stored as a hash.
- Signed updates only. With Update the agent automatically ticked, a new version is installed only when its HMAC-SHA256 signature matches the key the agent received at registration.
- No gaps. If the platform cannot be reached, samples are spooled locally (for about seven days at most) and sent in batches later.
- Light. One sample per minute at low priority (nice 10).
Thresholds and server alerts
Each server has its own thresholds under Edit server, in the Thresholds card. The defaults:
| Threshold | Default |
|---|---|
| CPU warning / critical % | 80 / 95 |
| Memory warning / critical % | 85 / 95 |
| Disk warning / critical % | 85 / 95 |
| Inode warning % | 85 |
| Swap warning % | 50 |
| Load average warning | 0 (off); critical at twice the value |
| CPU temperature warning °C | 85 |
| Offline after (minutes) | 5 |
| Samples in a row | 3 |
Samples in a row is the key to quiet, useful alerts. With the default of 3 and one sample a minute, CPU must stay above the line for three consecutive samples before you hear about it, so a short compile or backup spike does not page anyone. When a warning climbs into critical you are told again, and when the value drops back you get a "back to normal" message.
For the load average, the form suggests starting with the number of CPU cores: a 4-core server running at a load of 4 is fully busy. Besides thresholds, the agent raises alerts for:
- Server offline when no sample arrives for the configured minutes (an incident opens too), and Server back online;
- Server rebooted, detected from the uptime counter;
- Service or container stopped for the services you listed, Docker containers and disks at 95% or more;
- RAID array degraded and Disk SMART failure.
Server alerts go to the channels chosen on the server, or the default channels, and maintenance windows that include the server silence them. See the alerts documentation for every event.
Reading the server page
The server page starts with a Right now summary and then a History section with charts for CPU, memory, disk, load and network, over 1 hour, 6 hours, 24 hours, 7 days or 30 days. Below that come cards for every collector that sent data: CPU per core, disks, network interfaces, top processes, services, and the database or web server cards when they apply.
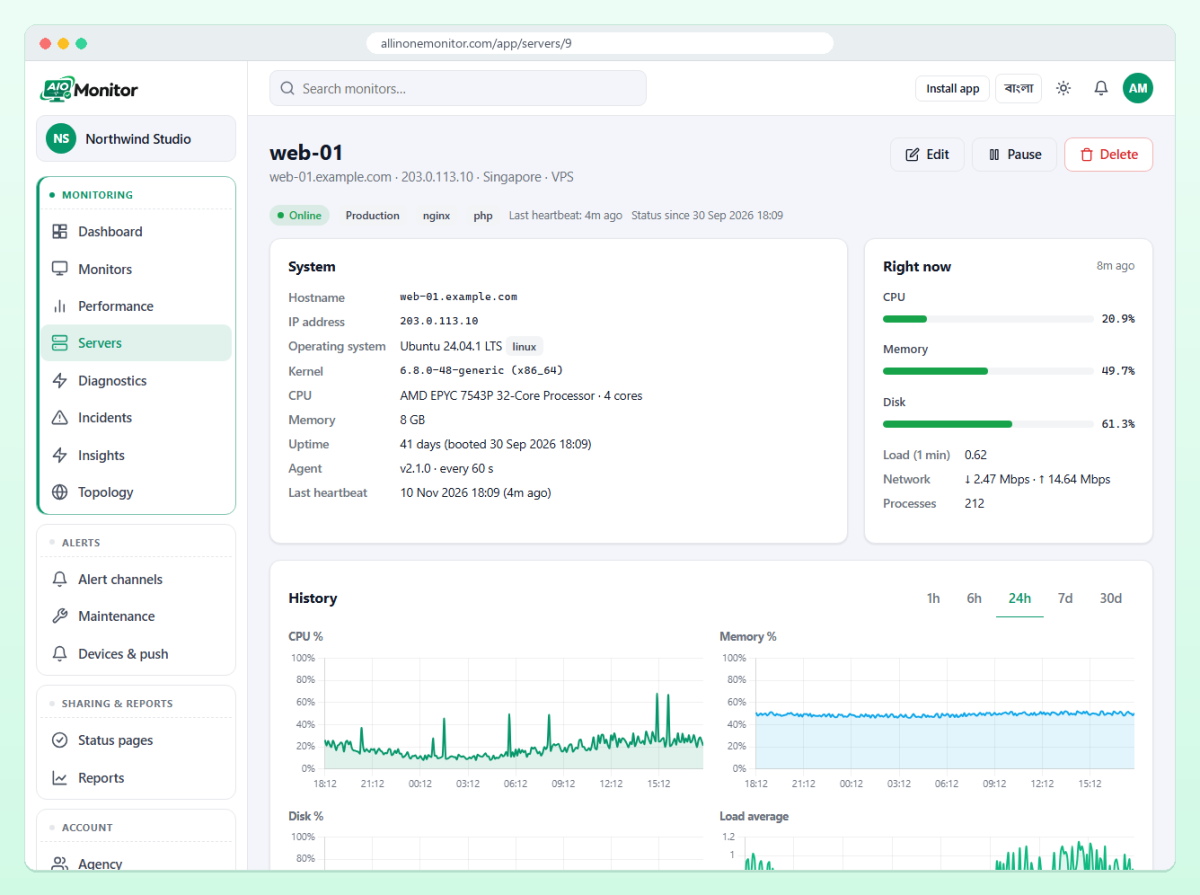
A section titled Not installed / not readable on this host lists the collectors that found nothing. That is normal: a web server without Docker simply has no Docker card.
Agent and external checks together
The agent watches the inside of the server; monitors watch what users reach. A practical setup for one web server:
- the agent, with nginx, PHP-FPM and the database listed under Services to watch;
- an HTTP(S) monitor for the main site;
- a port monitor for SSH or the database port if it must be reachable (see the port monitoring guide);
- a dependency on the Topology page so that, while the server is offline, the website's down alert is held back and you get one message instead of several.
Running Windows as well? The Windows server monitoring guide covers the PowerShell agent.
Frequently asked questions
Does the agent need any ports opened?
No. It only makes outbound HTTPS requests to the platform, so no inbound firewall rule is needed.
How much load does the monitoring agent add?
Very little. It takes one sample per minute by default, runs at low priority and gives slow tools a time limit. The CPU collector waits one second to measure usage.
How many servers can I monitor?
That depends on your plan; see the pricing page.
How do I remove the agent?
Run "aim-agent uninstall" as root. It stops and removes the service, the configuration, the spool and the script.
See inside your servers in one minute
Add a server, run one command and watch CPU, memory, disks and services with alerts that only fire when it matters.