
An uptime monitoring API lets your scripts do what you would otherwise click: create monitors when a site launches, pause them during a migration, pull uptime figures into your own dashboard and react to downtime events. AllInOneMonitor has a JSON REST API under /api/v1, bearer tokens with scopes you choose, and outbound webhooks that POST a signed event to your endpoint when a monitor goes down or comes back.
Key takeaways
- Tokens are created under API & webhooks, shown once, and limited by scopes, an optional expiry date and a requests-per-minute limit.
- A token can never do more than the role of the member who created it.
- Endpoints cover monitors, results, uptime, response times, incidents, alerts, servers, status pages, channels, webhooks and maintenance.
- Webhooks carry an HMAC-SHA256 signature and are retried with growing delays when your endpoint fails.
- Every answer is JSON with a clear error code, plus rate-limit headers.
What you can automate
The API is designed so that anything you do repeatedly in the panel can move into code. Typical uses:
- Provisioning: a deploy pipeline creates an HTTP, API or SSL monitor for every new site with
POST /monitors, and deletes it when the site is retired. - Deployments:
POST /maintenancesilences alerts for the affected monitors for 15 minutes, thenDELETE /maintenance/{id}ends the window; see our maintenance window guide. - Reporting:
GET /monitors/{id}/uptimereturns 24-hour to 365-day uptime and daily figures for your own reports. - Incidents:
POST /incidentsopens a manual incident from your tooling, and updates reach status-page subscribers. - Server data:
GET /servers/{id}/metricsfeeds agent metrics into another system.
Do not confuse this with monitoring your API. If you want to check that your own endpoint returns valid JSON, read our guide to API monitoring with JSON assertions.
Create a token with the right scopes
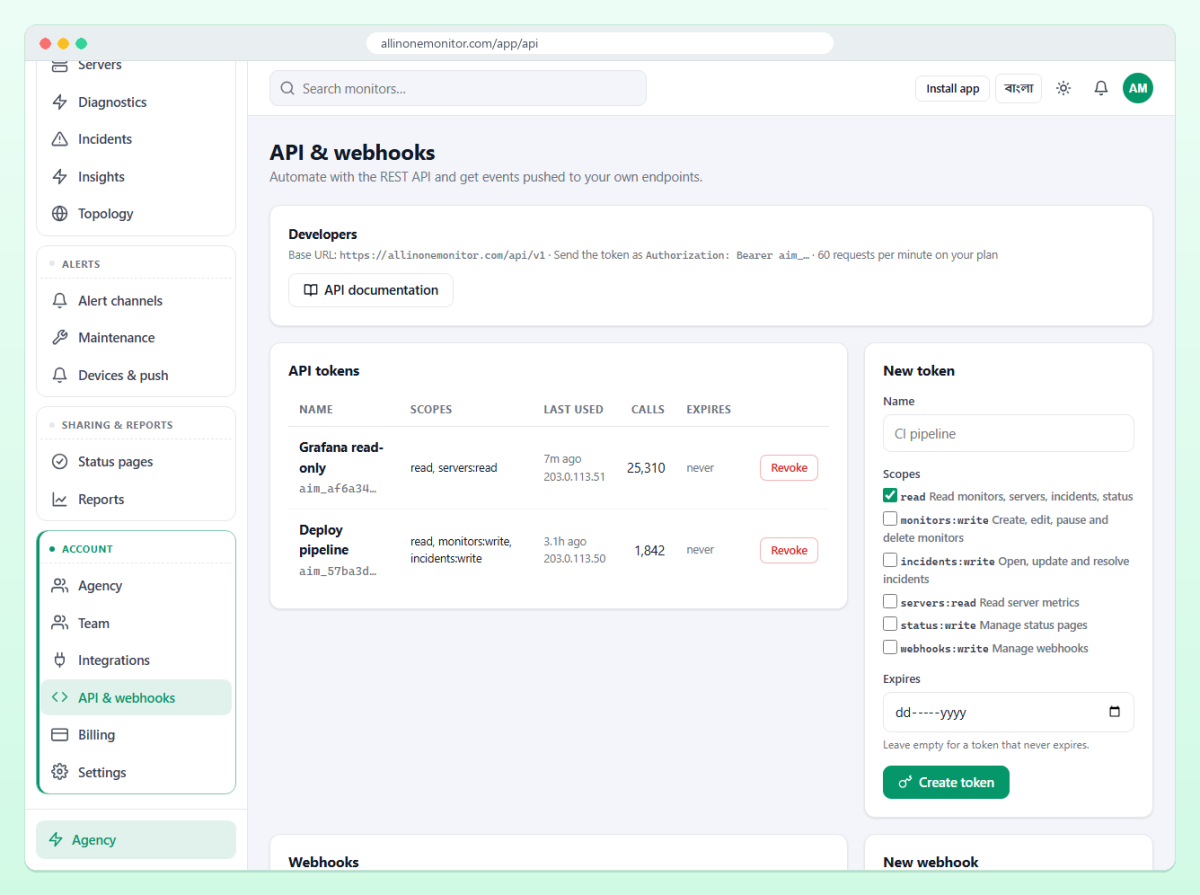
- Open API & webhooks in the panel and click New token.
- Give it a Name that says where it is used, such as "CI pipeline".
- Tick only the Scopes the script needs.
- Optionally set Expires; leave it empty for a token that never expires.
- Click Create token and copy the token (it starts with
aim_). It is shown only once; the platform keeps only a hash and the first characters.
| Scope | Allows |
|---|---|
read | Every GET endpoint: monitors, servers, incidents, status pages |
monitors:write | Create, change, delete, pause and resume monitors; create and delete maintenance windows |
incidents:write | Open manual incidents, post updates, acknowledge |
servers:read | Server metrics and services |
webhooks:write | Create and delete outbound webhooks |
A token acts as the member who created it, inside one organisation, and can never exceed that member's role: a Viewer's token cannot create monitors whatever its scopes. Revoking a token in the panel takes effect immediately. Whether API access is included, and how many tokens you may hold, depends on your plan; see Pricing.
Tip: Use one token per script or system, with the smallest set of scopes. When a laptop is lost or a CI secret leaks, you revoke one token and nothing else breaks.
Your first two calls
Every request sends the token as a bearer token. This lists the monitors that are down right now:
curl "https://your-domain/api/v1/monitors?status=down" \
  -H "Authorization: Bearer YOUR_TOKEN"
The answer is {"ok": true, "data": [...], "meta": {...}}, with each monitor's status, last error, interval and locations. Filters include status, type, q and group_id.
Creating a monitor needs the monitors:write scope. The body takes the same fields as the monitor form:
curl -X POST https://your-domain/api/v1/monitors \
  -H "Authorization: Bearer YOUR_TOKEN" \
  -H "Content-Type: application/json" \
  -d '{"type":"http","name":"Client site","url":"https://www.example.com","interval_sec":300,"confirmations":2}'
A new monitor answers 201 with its full record. A private or invalid target answers 422, and a plan limit 402. Intervals faster than your plan allows are clamped to the plan's minimum. Every field and monitor type is described in the monitors documentation.
To change a monitor later, send PATCH /monitors/{id} with only the fields that change; config keys are merged into the existing settings. POST /monitors/{id}/test runs the check right now from the main server without storing anything, which makes a handy smoke test at the end of a deploy pipeline.
Read uptime and response times
GET /monitors/{id}/uptime?days=30: uptime for 24 hours, 7, 30, 90 and 365 days, the current uptime streak and a daily list with checks, average response time and downtime.GET /monitors/{id}/response?hours=24: average, minimum and maximum, a bucketed series and figures per location.GET /monitors/{id}/results: raw results, newest first, filterable by location and status.GET /me/summary: one small status summary for a phone widget or a wall screen.
Lists are paginated with page and per_page (default 25, at most 100). Dates are UTC.
Webhooks for downtime
Polling for status changes wastes requests. Webhooks push them to you instead. Add one under API & webhooks → Webhooks with New webhook, or through POST /webhooks with the webhooks:write scope. Pick the events, or none for all of them: monitor.down, monitor.up, monitor.degraded, SSL and domain expiry, DNS and content changes, server offline and online, threshold alerts, incident updates and more.
Each delivery is a JSON POST with the event name, the monitor, the incident and the locations that saw the failure. The headers include X-AIM-Event, X-AIM-Delivery and, when the webhook has a secret, X-AIM-Timestamp and X-AIM-Signature. The signature is sha256= followed by the hex HMAC-SHA256 of the timestamp, a dot and the raw body, keyed with your secret. Check it, and reject timestamps older than a few minutes, before you trust the payload.
Answer with any 2xx status within 15 seconds. Other answers are retried with growing delays (1, 4, 9 and 16 minutes, 5 attempts), every attempt is in the delivery log with a Redeliver button, and after 50 consecutive failures the webhook is switched off until you enable it again. Webhooks are sent even during maintenance windows, because they feed your own code.
Rate limits and errors
Each token has a requests-per-minute limit, taken from your plan unless one is set on the token. Every answer carries X-RateLimit-Limit and X-RateLimit-Remaining; over the limit you get 429 with Retry-After. Errors are JSON with a machine-readable code:
| HTTP | Code | Meaning |
|---|---|---|
| 401 | unauthorized | Missing, unknown, revoked or expired token |
| 402 | plan_limit | The plan does not allow one more |
| 403 | forbidden | Missing scope or permission |
| 422 | validation | A field is wrong |
| 429 | rate_limited | Too many requests this minute |
Scripts that react to these codes, rather than to message text, keep working when wording changes.
Automation recipes
- After a new client site goes live, create an HTTP monitor, an SSL monitor and a domain monitor in one script.
- Wrap every production deploy in a short maintenance window for the affected monitors.
- Have backup scripts call a cron job monitoring heartbeat URL, and let a webhook on
monitor.downopen a ticket in your own system. - Export 30-day uptime per monitor every month with the uptime endpoint for client billing.
The full reference lives in the API documentation, and a shorter overview on the developers page.
Frequently asked questions
How do I authenticate with the uptime monitoring API?
Create a token under API & webhooks and send it as a bearer token in the Authorization header of every request.
Can I create and pause monitors through the API?
Yes. With the monitors:write scope you can create, change and delete monitors, and pause or resume them with their own endpoints.
How do I get notified of downtime in my own system?
Add an outbound webhook for the monitor.down and monitor.up events. Each delivery is a signed JSON POST to your endpoint and is retried if it fails.
Is there a rate limit?
Yes. Each token has a requests-per-minute limit from the token or the plan, and every answer reports the limit and what remains.
Put your monitoring on autopilot
Create a scoped token, script your monitors and maintenance, and let webhooks bring downtime events into your own tools.