
An uptime SLA calculation divides the time a service was available by the total time in the period and multiplies by 100. Turned around, it tells you the downtime you are allowed: 99.9% uptime permits 43 minutes 12 seconds of downtime in a 30-day month, and 8 hours 45 minutes 36 seconds in a 365-day year.
Key takeaways
- Uptime % = (period length − downtime) ÷ period length × 100.
- Each extra "nine" cuts the allowed downtime by a factor of ten: about 7 hours a month at 99%, 43 minutes at 99.9%, 4 minutes at 99.99%.
- Always state the month length you use; this guide uses 30 days (43,200 minutes) and 365-day years.
- Your measurement is only as fine as your check interval, so pick an interval that matches the SLA you promise.
- AllInOneMonitor's Reports page gives uptime, downtime and incidents per monitor for any date range, with CSV and print export.
The uptime formula
For any period:
uptime % = (total minutes − downtime minutes) ÷ total minutes × 100
allowed downtime = total minutes × (1 − SLA % ÷ 100)
A worked example: a 30-day month has 30 × 24 × 60 = 43,200 minutes. If your site was down for 30 minutes, uptime is (43,200 − 30) ÷ 43,200 × 100 = 99.931%. That meets a 99.9% SLA, but not 99.95%.
The reverse calculation is what most people search for: at 99.9%, the allowed downtime is 43,200 × 0.001 = 43.2 minutes, which is 43 minutes 12 seconds.
Allowed downtime table
The table below uses a 24-hour day, a 7-day week, a 30-day month (43,200 minutes) and a 365-day year (525,600 minutes). Seconds are rounded to one decimal where needed.
| SLA | Per day | Per week | Per 30-day month | Per 365-day year |
|---|---|---|---|---|
| 99% | 14m 24s | 1h 40m 48s | 7h 12m | 3d 15h 36m |
| 99.5% | 7m 12s | 50m 24s | 3h 36m | 1d 19h 48m |
| 99.9% | 1m 26.4s | 10m 4.8s | 43m 12s | 8h 45m 36s |
| 99.95% | 43.2s | 5m 2.4s | 21m 36s | 4h 22m 48s |
| 99.99% | 8.6s | 1m 0.5s | 4m 19.2s | 52m 33.6s |
Month length changes the answer slightly. At 99.9%, a 31-day month allows 44m 38.4s and a 28-day February allows 40m 19.2s. If your contract measures by calendar month, say so, and calculate each month with its real number of days.
Nines of availability in plain words
People describe availability by counting nines: 99.9% is "three nines", 99.99% is "four nines". Each additional nine divides the allowed downtime by ten, and the cost of reaching it usually rises much faster than that.
- Two nines (99%): room for a few hours of trouble a month. Fine for internal tools.
- Two and a half nines (99.5%): one longer incident a month.
- Three nines (99.9%): a common target for business websites and SaaS. One bad deploy that takes 45 minutes to roll back already breaks it.
- Three and a half nines (99.95%): needs fast detection and a practised response; there is no time for someone to notice the outage by chance.
- Four nines (99.99%): about four minutes a month. Realistic only with redundancy and automatic failover, since a human usually cannot even acknowledge an alert that fast.
Measurement resolution: why the check interval matters
An SLA is only as precise as the data behind it. A monitor that checks every 5 minutes runs 8,640 checks in a 30-day month; one that checks every minute runs 43,200. That has two consequences.
- Short outages can fall between checks. With a 5-minute interval, a 3-minute outage may never be seen, while a single failed check may stand for anything between a few seconds and 5 minutes of real downtime.
- Each failed check weighs more. At 8,640 checks a month, one failed check is about 0.0116% of the month. A 99.9% target allows only 8.64 failed 5-minute checks; at a 1-minute interval it allows 43.2 failed checks.
A useful rule: for a 99.9% SLA, check at least every minute; for 99.99%, use the fastest interval your plan offers, ideally 30 seconds, and several locations so a problem on one network does not count against you. Our guide to choosing a monitoring check interval goes into the trade-offs, and the pricing page shows which intervals each plan includes.
How AllInOneMonitor calculates uptime in reports
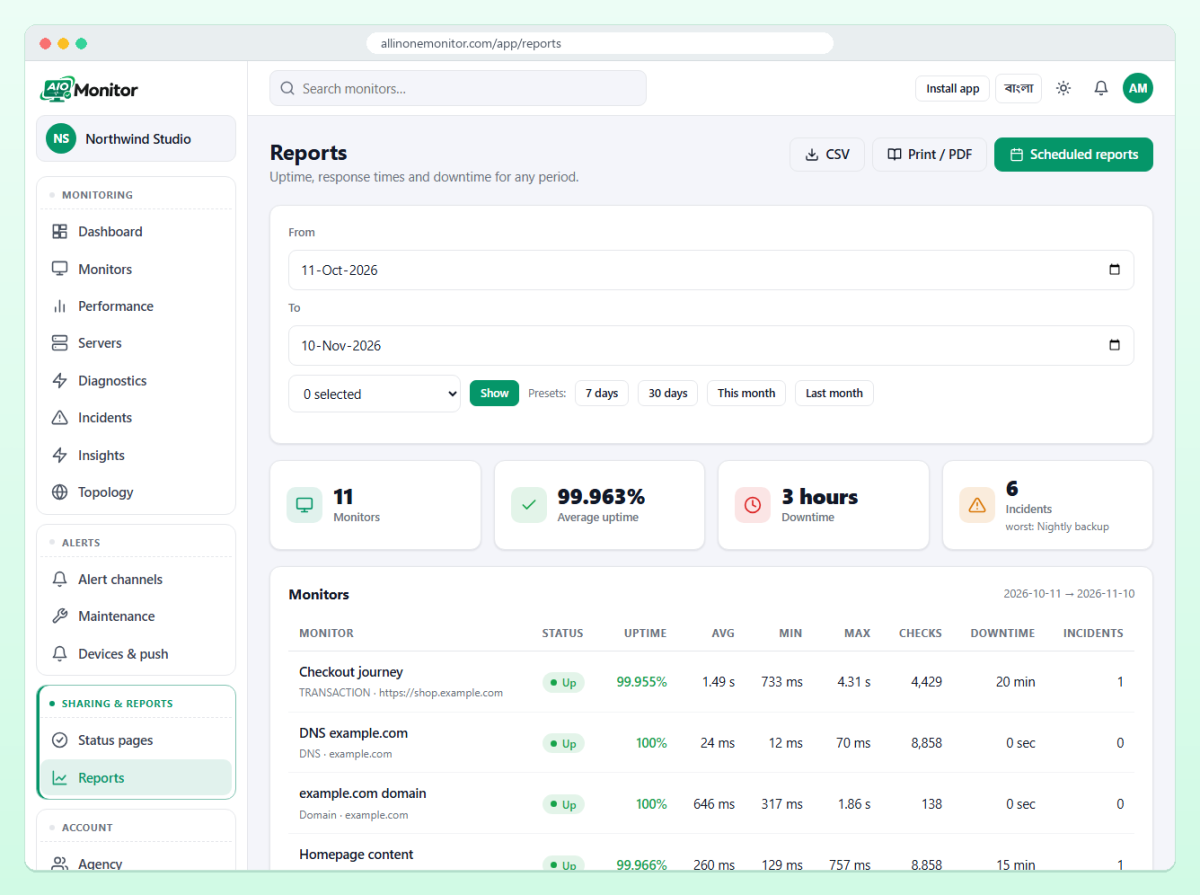
Open Reports, choose a From and To date (or a preset such as 7 days, 30 days, This month or Last month), optionally select monitors, and click Show. Dates are whole UTC days, both included. For every monitor you see its status, uptime, average, minimum and maximum response time, the number of checks, the downtime and the number of incidents, plus a summary with the average uptime, total downtime, total incidents and the worst monitor.
Two figures are worth understanding before you put them in an SLA report:
- Uptime is the share of checks in the period that came back up. With several locations, each location's result counts as a check, so a failure seen from only one region lowers the percentage a little.
- Downtime is the summed duration of the monitor's incidents in the period, so it only counts failures that were confirmed and opened an incident (Down, or Degraded when only some locations failed).
Because one is based on checks and the other on confirmed incidents, they can differ slightly: a single failed check that never reached your confirmation threshold lowers uptime but adds no downtime. For a contract, decide in advance which one you report. Past days come from daily roll-ups that are kept for the full history period, so long-range reports still work after raw results are pruned; the reports documentation has the details.
For a quick check between reports, every monitor page shows stat cards for Uptime 24h, Uptime 7d, Uptime 30d and Uptime 90d, plus a Last 90 days card with the uptime of each day. A glance at the 30-day card tells you whether this month is on track long before the monthly report arrives, and the daily bars show which days had trouble, so you know which incidents to look at first.
Tip: Maintenance windows silence alerts, but checks keep running and results are still recorded. If your SLA excludes announced maintenance, note the windows and subtract them yourself when you prepare the customer report.
Producing an SLA report step by step
- Decide which monitors represent the service in the SLA, for example the homepage, the API health endpoint and the checkout journey.
- In Reports, choose Last month (or the contract period) and select those monitors.
- Check the uptime of each monitor against the allowed downtime in the table above, using the real number of days in the month.
- Open the incidents behind any downtime from the Incidents page; their timelines and root-cause notes explain each one. Our incident communication guide shows how to keep those notes useful.
- Export with CSV for a spreadsheet, or Print / PDF and save the print view as a PDF for the customer.
- To automate it, open Scheduled reports and create a schedule with the frequency Monthly (the 1st, last month), the recipients and the monitors. The report arrives by e-mail at 06:00 UTC on the first of each month.
Writing an SLA you can measure
Many SLA disputes come from vague wording, not from outages. Before you promise a number, write down:
- What is measured: which URLs or services, and what counts as "up" (status code, keyword, response time limit).
- How it is measured: the check interval, the number of locations and how many must agree, which in AllInOneMonitor is the Confirmations setting described in the monitor documentation.
- The period: calendar month in UTC is the most common choice.
- Exclusions: announced maintenance, problems caused by the customer, and outages of third parties outside your control.
- The remedy: what the customer receives if the target is missed, such as a service credit.
Then publish your live numbers on a status page so customers can follow along; see website uptime monitoring for setting up the monitors behind it.
Frequently asked questions
How much downtime does 99.9% uptime allow per month?
43 minutes 12 seconds in a 30-day month, 44 minutes 38 seconds in a 31-day month, and 8 hours 45 minutes 36 seconds over a 365-day year.
How do I calculate uptime percentage?
Subtract the downtime from the total time in the period, divide by the total time and multiply by 100. For example, 30 minutes of downtime in a 30-day month gives 99.931%.
What is the difference between 99.9% and 99.99% uptime?
99.99% allows ten times less downtime: about 4 minutes 19 seconds per 30-day month instead of 43 minutes 12 seconds.
Does scheduled maintenance count as downtime?
That depends on your SLA wording. In AllInOneMonitor, maintenance windows silence alerts but checks are still recorded, so subtract announced maintenance yourself if your contract excludes it.
Measure the uptime you promise
Start checking your services today and have a month of uptime, downtime and incident data ready for your next SLA report.