
MySQL monitoring means proving more than an open port 3306: the server must accept a sign-in, answer a query, stay below its connection limit and keep its replicas close behind. AllInOneMonitor does this in two ways - a MySQL / MariaDB monitor that connects from outside like a real client, and a read-only server agent that reads the database from inside the machine. The same two tools cover Redis, PostgreSQL, MongoDB and Memcached.
Key takeaways
- A MySQL / MariaDB monitor signs in, runs one
SELECTorSHOWinside a read-only transaction and can compare the answer with an expected value. - Replication lag and connection rules turn a replica that silently falls behind into a Down status and an alert.
- A Redis monitor sends
PING, readsINFOand can enforce memory use, the server role and replica lag. - The Linux agent reads MySQL, PostgreSQL, MongoDB, Redis and Memcached locally, with credentials that never leave the server.
- Give every monitor its own database user with only the rights its query needs.
Outside-in or inside-out: two ways to watch a database
A database can fail in ways a port check never sees: a rotated password, a full connection table, a replica that stopped copying data hours ago. Catching those needs checks that speak the database protocol, and AllInOneMonitor offers two:
| Protocol monitor | Agent collector | |
|---|---|---|
| Runs from | The main server or the probes you pick as locations | The database server itself, every agent sample |
| Proves | The database answers over the network, sign-in works, the query returns | Internal health: connections, slow queries, replication, memory |
| Credentials | Stored encrypted on the monitor, masked as *** in errors | Only in /etc/aim-agent/collectors.conf on the server |
| Needs | A public host name or IP (private addresses are refused) | The Linux agent and the client tool (mysql, redis-cli ...) |
| Alerts | Down / Up of the monitor, SSL expiry when TLS is checked | Server threshold alerts and "back to normal" |
Use the protocol monitor when the database is reachable from outside, and the agent when it listens only on localhost or a private network.
How to set up a MySQL / MariaDB monitor
- Open Monitors and click Add monitor.
- Under What to monitor, choose MySQL / MariaDB.
- In Basics, enter a Name (for example "MySQL db-01") and the Host, then pick the Check interval, Timeout (seconds) and Confirmations.
- In the Service connection card, leave Port empty to use 3306, choose the TLS mode and Certificate checks, and fill in User name and Password.
- In Database checks, optionally set Database, Query, Expected value, Max replication lag (s) and Max connections used (%).
- Click Test now to run the check once, then Create monitor.
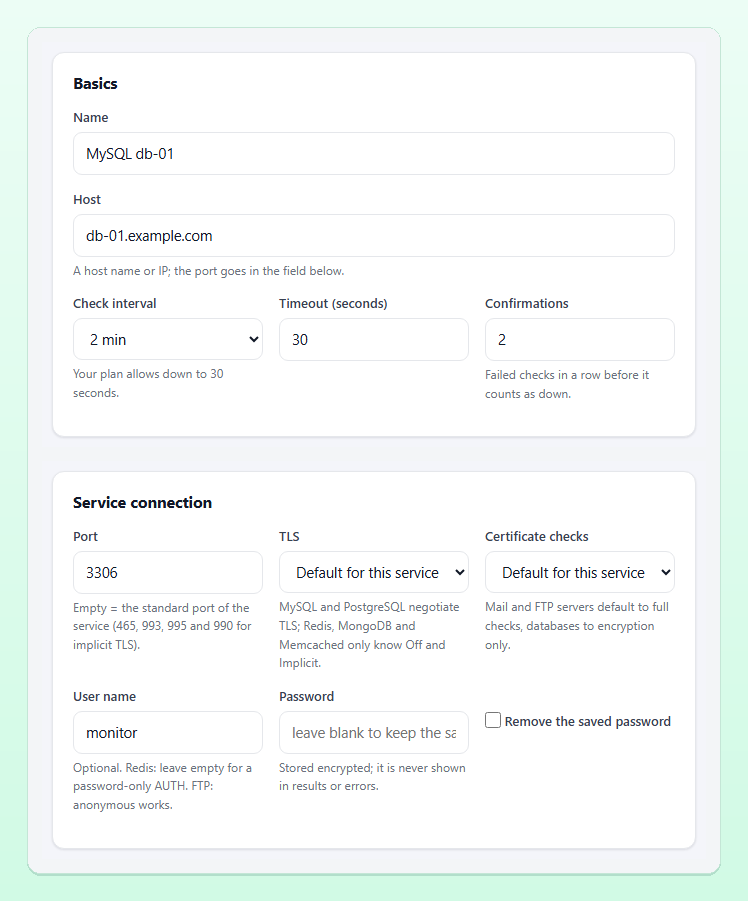
Without a user name the monitor only reads the server greeting. A real sign-in catches far more: a revoked grant, a full connection table or an authentication plugin changed by an upgrade. The check supports mysql_native_password, caching_sha2_password (MySQL 8; the full exchange needs TLS or the server's RSA key) and sha256_password.
TLS and certificate checks
For MySQL the TLS mode defaults to When the server offers it and the certificate check to encryption only. Pick Required (STARTTLS / TLS request) if the database must never talk in clear text: the check is then Down when the server stops offering TLS. When the server has a proper certificate, choose Trusted chain, host name and expiry; the expiry date is then saved on the monitor and the daily SSL expiring alert covers the database certificate too.
A read-only query that proves data is fresh
An empty Query runs SELECT 1. You can replace it with one SELECT or SHOW statement of up to 2,000 characters. Comments, a second statement, SELECT ... INTO and locking reads are refused when you save, and the query runs between START TRANSACTION READ ONLY and ROLLBACK, so nothing is ever written. Expected value must equal the first column of the first row.
SELECT COUNT(*) > 0 FROM orders WHERE created_at > NOW() - INTERVAL 1 HOUR
SHOW GLOBAL STATUS LIKE 'Threads_connected'
With the first query and an expected value of 1, the monitor proves that new orders are still arriving, not just that the server is up. Choose a table that is written around the clock, or the check will fail during quiet hours.
Tip: Create a dedicated user such as monitor, allow it only from the addresses that run your checks, and grant SELECT on the tables your query reads plus REPLICATION CLIENT if you want replication figures. A rule whose figure the user cannot read is noted in the details and not applied.
Replication lag alerts that fire before users notice
Replicas fall behind quietly, and stale reports are often the first sign. Set Max replication lag (s) (1 to 604,800) on a monitor that points at a replica: the check reads SHOW REPLICA STATUS (or SHOW SLAVE STATUS on older servers) and is Down when replication stopped, the lag is unknown, or it is above your limit.
Max connections used (%) compares threads connected with max_connections. A value of 90 gives you a warning window before the server starts refusing new clients.
The agent adds a second, earlier layer. Under Edit server → Thresholds, Replication lag warning (s) defaults to 300 seconds, and for MySQL the alert turns critical at four times that value (1,200 seconds with the default). A stopped IO or SQL thread is critical straight away. Database connections warning % (default 85) and MySQL slow queries per sample (off by default) complete the picture. If you want fewer, better alerts, read our guide on how to reduce false alerts.
Redis monitoring: PING, memory, role and replicas
A Redis monitor signs in with AUTH password, or AUTH user password when you fill in a user name for an ACL user, then sends PING and expects PONG. A server that needs a password you did not give is Down with "NOAUTH". It then reads INFO: version (Valkey too), clients, memory against maxmemory, hit ratio, evicted keys, role and replication.
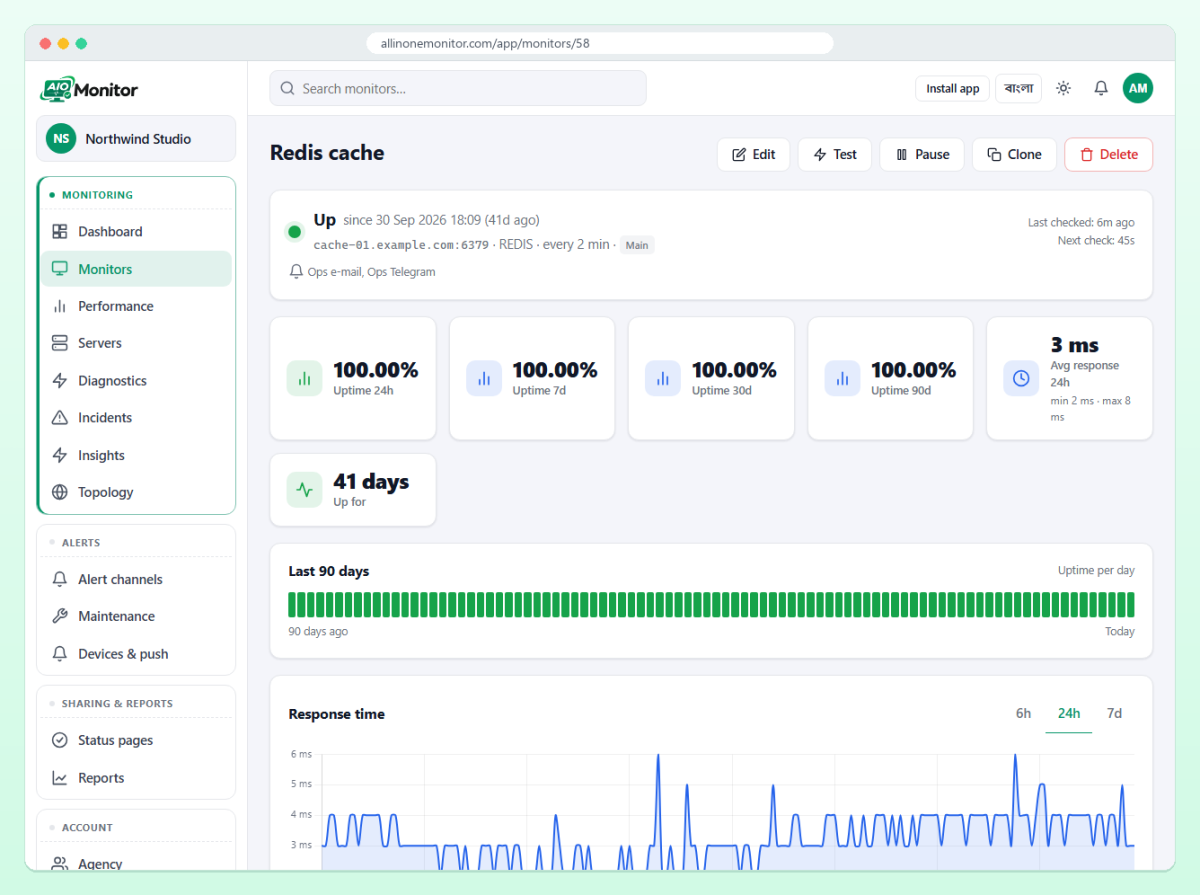
Three rules turn those figures into a verdict:
- Max memory used (%): Down above the limit, applied only when
maxmemoryis set. - Required role: Primary / master or Replica / secondary. Useful when your app must write to the node it points at; after a failover that turned it into a replica, the check goes Down.
- Max replication lag (s): on a replica, a link that is not up is Down as well.
Redis uses port 6379 by default and knows only two TLS modes, Off and Implicit TLS from the first byte, which is right for a TLS-only Redis.
Database monitoring from inside the server
When MySQL or Redis listens only on 127.0.0.1, the Linux server monitoring agent is the right tool. It runs on the machine, posts samples outbound over HTTPS and never opens a port. Its mysql, postgres, mongodb, redis and memcached collectors run when the client tool exists on the host. Database credentials live only in an optional local file:
aim-agent conf-example > /etc/aim-agent/collectors.conf
chmod 600 /etc/aim-agent/collectors.conf

# then uncomment what you need, for example:
MYSQL_DEFAULTS_FILE=/root/.my.cnf
REDIS_HOST=127.0.0.1
REDIS_PORT=6379
REDIS_PASSWORD=secret
The file is parsed as KEY=value lines and never executed; when the agent runs as root it must be owned by root and not writable by others. MySQL passwords are passed through the environment and the Redis password through REDISCLI_AUTH, never on the command line. When a tool is installed but the agent cannot sign in, the server page says so and names the keys to set.
The server page then shows MySQL connections, slow queries and replication (IO and SQL thread, seconds behind source, last error), and Redis memory, clients, hit ratio and evicted keys. Redis memory warning % defaults to 90, and a database the agent reached before but cannot reach for two samples in a row raises a critical alert. Note that the Windows agent has no database collectors; see our Windows server monitoring guide for what it tracks instead.
PostgreSQL, MongoDB and Memcached
PostgreSQL monitors run a read-only query and check replay lag, MongoDB monitors can require a primary or a secondary, and Memcached monitors judge memory and connections. Every field is explained in the database and mail server monitors documentation, and the agent side in the servers and agent docs.
A practical database monitoring checklist
- One MySQL / MariaDB monitor per primary with a sign-in and a freshness query.
- One monitor per replica with Max replication lag (s) set to what your application tolerates.
- Max connections used (%) on busy servers, so you hear about pressure before refusals.
- A Redis monitor with Required role and Max memory used (%) where Redis holds sessions or queues.
- The agent with
collectors.confon every database host for slow queries and internal figures. - Firewall rules that open the database port only to the addresses running your checks.
How many monitors, servers and locations you can use depends on your plan; see Pricing.
Frequently asked questions
Can I monitor a MySQL database that is not exposed to the internet?
Protocol monitors refuse private and internal addresses, so a database that listens only on localhost or a private network is best watched by the server agent, which reads it locally and sends its figures outbound.
Does the MySQL monitor write anything to my database?
No. The query must be a single SELECT or SHOW statement and runs inside a read-only transaction that is rolled back, so nothing is written.
How do I get an alert when MySQL replication lag grows?
Point a MySQL / MariaDB monitor at the replica and set Max replication lag (s), or use the agent's Replication lag warning (s) threshold on the server. The monitor user needs the REPLICATION CLIENT right to read the status.
Does Redis monitoring work with a password or an ACL user?
Yes. Leave the user name empty for a password-only AUTH, or enter both for an ACL user. The password is stored encrypted and masked in results.
Know your database is really answering
Add a MySQL or Redis monitor in a few minutes and get an alert the moment sign-in, queries or replication go wrong.