
Response time monitoring measures how long your website or API takes to answer each check, keeps the history, and alerts you when it gets too slow. The useful signals are the trend on a chart, percentiles such as p95 rather than a single average, time to first byte (TTFB) for server-side slowness, and two kinds of alert: a hard response time threshold and an anomaly alert when a page is much slower than its normal value.
Key takeaways
- A slow site loses visitors long before it goes down, so response time deserves its own alerts.
- Use p95 to see what your slower visitors experience; averages hide the tail.
- TTFB separates server and network time from everything that happens after the first byte arrives.
- AllInOneMonitor offers a hard limit (Max response time (ms)) and learned baselines that flag response-time anomalies.
- The Performance page compares this week's p95 with the week before, per monitor and per location.
What "response time" actually measures
For an HTTP(S), Keyword or API monitor, the response time is how long one request took from the monitoring location: resolving the name, connecting, the TLS handshake, waiting for the server, and downloading the response. Each result also stores the time to first byte and other timings, the status code, the final URL after redirects, the IP that answered and the response size.
It helps to split that total into two parts:
- Up to the first byte (TTFB): network distance, DNS, connection set-up and, mostly, how long your server needed to build the page. A high TTFB usually points at the application, the database or a missing cache.
- After the first byte: transferring the body. Large pages, uncompressed responses or a slow link make this part grow.
Other monitor types measure their own kind of time. A DNS monitor records the lookup time, a Port monitor the time to accept a TCP connection, and a Ping monitor the round-trip latency. A Browser monitor goes further and loads the page in a real headless Chrome, recording paint metrics such as LCP; see the synthetic monitoring docs.
Reading the response time chart
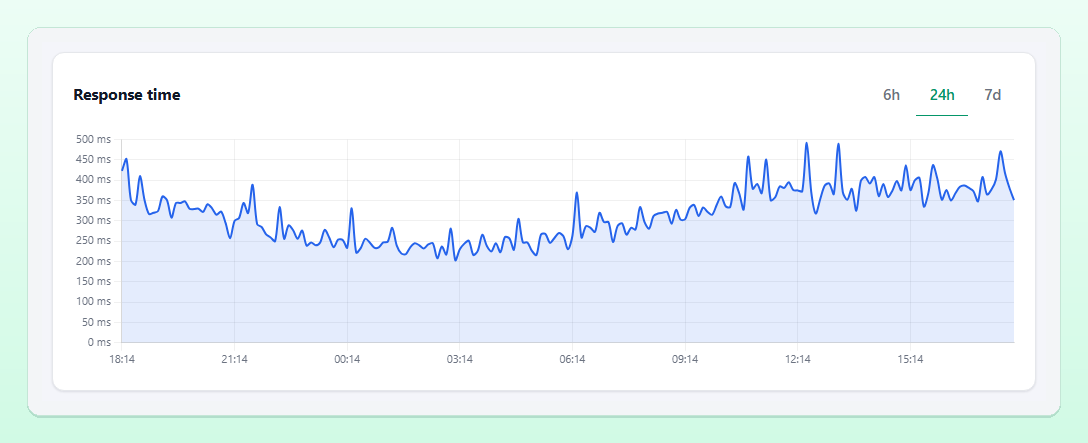
Every monitor page has a Response time card with a chart for the last 6h, 24h or 7d. Points are averaged into time buckets, so even a 30-second monitor stays readable over a week, and only successful checks are drawn, because a timeout is an outage, not a slow answer. Above it, the Avg response 24h card shows the average with the minimum and maximum.
What to look for:
- A step up after a deployment or a configuration change: something made every request slower.
- A daily wave that rises with traffic: the server is close to its capacity at peak hours.
- Spikes at the same time every day or night: backups, cron jobs or cache rebuilds competing with visitors.
- A slow creep over weeks: a growing database table, a log file or a cache that is no longer effective.
If the monitor runs from several locations, the By location (24h) card shows the average for each one. Differences between locations are normal, since distance adds latency; a sudden change at one location only points at a network problem rather than your server. Our guide on how to monitor a website from multiple locations explains this further.
Percentiles: why p95 beats the average
An average blends fast and slow answers into one number. If 95 checks take 200 ms and 5 take 4 seconds, the average is 390 ms, which describes nobody's experience. Percentiles are clearer:
- p50 (median): half the checks were faster than this. It shows the typical experience.
- p95: 95% of checks were faster, 5% were slower. It shows what your unluckiest regular visitors see.
The Performance page in the menu lists your HTTP, Keyword, API and Browser monitors with p50 24h, p95 24h, p95 7d (the week before the last 24 hours), the Change between them, plus First byte, LCP for browser monitors and Page size from the newest check. A monitor is marked Performance degraded when its p95 over the last 24 hours is more than 50% above the 7-day p95, with enough checks in both periods. That marker is a notice on the page, not an alert, which makes the page a good weekly review rather than a pager.
Click a monitor to open its performance detail for 24h, 7d or 30d: p50 and p95 cards, average first byte, a response time breakdown into DNS, connect, TLS, first byte and total, the page size over time, and a By location table with average and p95 per location.
Setting a response time threshold
The simplest slow website alert is a hard limit. In the Basics card of an HTTP(S), Keyword, API, Ping or DNS monitor, fill in Max response time (ms). A check slower than the limit counts as Down, with an error such as Response took 1200 ms (limit 300 ms), and goes through the usual confirmations, incident and alerts.
Because a slow check becomes a Down result, choose the number carefully:
- Look at the chart and the p95 for at least a few days of normal traffic.
- Set the limit well above the normal p95, typically two to three times higher, so it fires on real trouble rather than on a busy minute. For a page that normally answers in 400 ms with a p95 of 700 ms, 2,000 ms is a reasonable start.
- Raise Confirmations to 2 or 3 so one slow check does not open an incident.
- Keep the Timeout (seconds) higher than the threshold. The timeout ends a request that is not answering at all; the threshold judges answers that did arrive.
Tip: A threshold on your status page monitor also turns slowness into visible "down" time for customers. If you want to track speed without affecting public uptime, put the threshold on a second, private monitor for the same URL and keep the public one for availability only.
Anomaly alerts: "slower than usual" instead of a fixed number
A fixed threshold cannot know that your API is normally 120 ms at night and 450 ms at the daily peak. AllInOneMonitor's Insights layer learns that for you. Every hour it refreshes a baseline for each monitor from the successful checks of the last 14 days, per hour of the day, using the median and a robust measure of spread. An anomaly opens when three checks in a row from the same location are successful but slower than the alert line for that hour. The line never sits less than 150 ms above the median, so small wobbles on a very steady service do not count.
The message is specific: the current response time, the usual value at that hour, and the alert line. Anomalies always appear on Insights and in webhooks. To have them sent to your channels as well, tick Send response-time anomalies to my alert channels in the monitor form's Dependencies & anomalies card, and make sure the channel takes the Response time unusual (anomaly) event. A new monitor shows no anomalies during its first days, because it has no history yet. The intelligence documentation gives the exact formula.
Which alert to use when
| Goal | Use |
|---|---|
| Page users if the site is unusably slow | Max response time (ms) with Confirmations of 2 or more |
| Notice that something got slower than normal, even if still acceptable | Anomalies, sent to a chat or e-mail channel |
| Spot gradual regressions week over week | The Performance page and its Performance degraded marker |
| Measure what a real browser sees, including scripts and images | A Browser monitor with LCP, FCP and CLS |
| Time a whole journey such as login and checkout | A Transaction monitor, with time per step |
For multi-step journeys, the total time of a Transaction monitor is the sum of its steps, and the monitor page lists each step's time, which makes it easy to see whether login or payment is the slow part. Our guide to synthetic transaction monitoring walks through one. And if slow-but-working pages keep paging you at night, the advice in how to reduce false alerts applies here too.
Frequently asked questions
What is a good website response time?
It depends on the page and the distance to your visitors, but for a server-rendered page a TTFB of a few hundred milliseconds is a common goal. Compare against your own baseline and watch the p95 rather than chasing one number.
How do I get an alert when my website is slow?
Set Max response time (ms) on the monitor, so slower checks count as Down, or tick the option to send response-time anomalies to your alert channels to be told when the site is much slower than usual.
What is the difference between TTFB and response time?
TTFB is the time until the first byte of the answer arrives, covering connection set-up and server processing. Response time also includes downloading the rest of the response.
Why does response time differ between monitoring locations?
Distance and network paths add latency, so a location far from your server is naturally slower. Compare each location against its own history, not against the others.
Catch slow pages before your users do
Add a monitor, watch its response time chart fill in, and set a threshold or anomaly alerts that fit your site. See all monitoring features on the features page.