
API monitoring sends a real request to your endpoint on a schedule, with the method, headers, authentication and body your clients use, and then validates the answer: the status code, the response headers, the response time and the content of the JSON or XML body. JSON assertions such as status == ok catch the failures that a plain "200 OK" check misses.
Key takeaways
- A status code alone is not proof that an API works; many failures still return 200.
- JSON assertions check specific fields with simple rules: equals, greater than, contains, exists, matches a pattern.
- Monitor with the same authentication your clients use, so expired keys and broken auth are caught too.
- A dedicated health check endpoint that reports its dependencies makes API monitoring far more useful.
- Use Test now to see the real response and refine the rules before you save.
Why "200 OK" is not enough for an API
APIs fail in quieter ways than websites. A gateway returns 200 with an HTML error page. A backend answers {"status":"error","message":"database unavailable"} with a success code. A list endpoint returns an empty array because a sync job stopped. A new deployment renames a field and every mobile app crashes on parsing. In all of these, a basic availability check stays green.
REST API monitoring closes the gap by reading the response the way a client would, and failing the check when the content is wrong.
Design an API health check endpoint worth monitoring
You can monitor any endpoint, but a dedicated health check makes the result much more meaningful. A good one:
- lives at a stable path, for example
/v1/health; - checks the dependencies the API cannot work without, such as the database, cache and queue, with short timeouts;
- returns a small JSON document with an overall status and one field per dependency;
- uses a non-2xx status code when the service is unhealthy, so even a basic check notices;
- is cheap enough to call every minute and never exposes secrets.
An example response:
{
  "status": "ok",
  "version": "2.4.1",
  "checks": {
    "database": "ok",
    "cache": "ok",
    "queue": { "depth": 12 }
  },
  "maintenance": false
}
Set up a REST API monitor step by step
- Open Monitors and click Add monitor.
- Choose API in the What to monitor card.
- In Basics, name it ("Status API") and enter the URL, such as
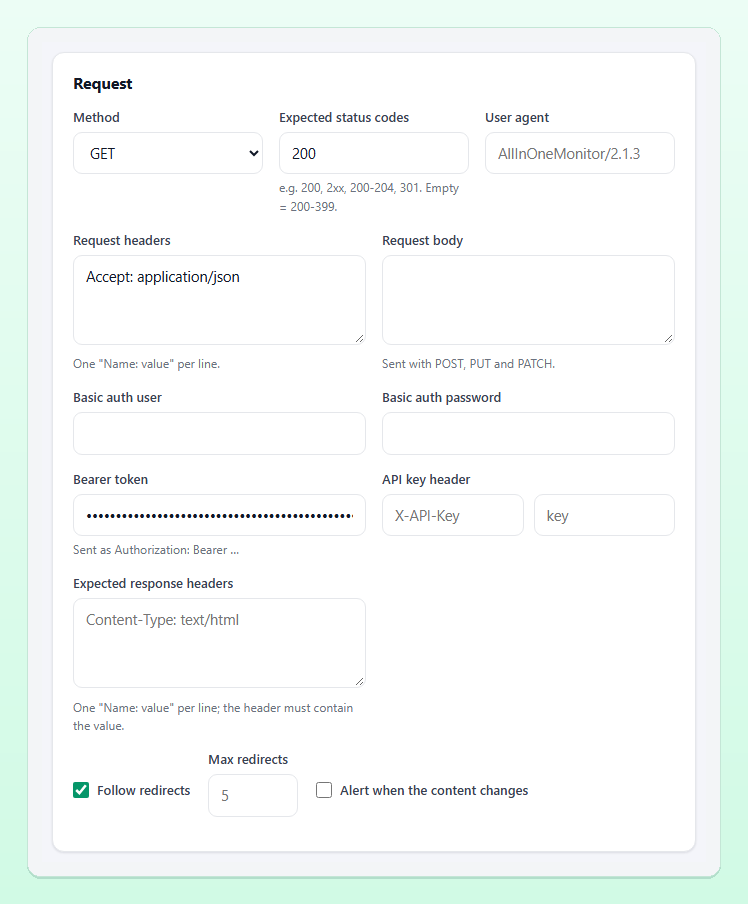
https://api.example.com/v1/health. Choose the Check interval and keep Confirmations at 2. - In the Request card, choose the Method and set Expected status codes (for example
200, or2xx). - Add Request headers, one
Name: valueper line, such asAccept: application/json. - Add authentication: a Bearer token (sent as
Authorization: Bearer …), an API key header with its key, or Basic auth user and password. - For POST, PUT and PATCH, fill in the Request body. A JSON body is sent with
Content-Type: application/jsonautomatically unless you set the header yourself. - In the Response validation card, choose the Response format and write your rules (see below).
- Click Test now, read the result, adjust, then Create monitor.
Tip: Create a dedicated, read-only API key for monitoring. If it leaks or needs rotating, nothing else breaks, and you can tell monitoring traffic apart in your logs. Tokens and passwords in the form are stored encrypted.
Writing JSON assertions
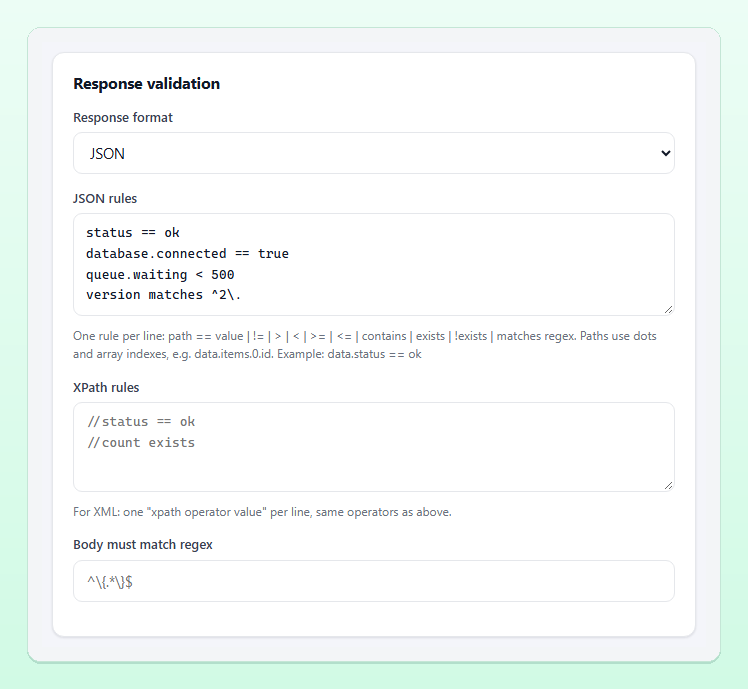
The JSON rules field takes one rule per line: a dotted path, an operator and a value. Every rule must pass for the check to be Up. Rules for the example response above:
status == ok
checks.database == ok
checks.cache == ok
checks.queue.depth < 1000
version matches ^2\.
maintenance == false
error !exists
Operators
| Operator | Meaning | Example |
|---|---|---|
== / != | String comparison; booleans compare as true or false | status == ok |
> < >= <= | Numeric comparison | count > 3 |
contains | Substring, or an element of an array | tags contains production |
exists / !exists | The path is present or absent | data.id exists |
matches | Regular expression, without delimiters | version matches ^2\. |
Paths
Paths use dots for both object keys and array indexes, so the id of the second item in a list is data.items.1.id. A body that is not valid JSON fails the check at once, which on its own catches gateways and proxies that answer with an HTML error page.
XML and plain responses
For XML APIs, set Response format to XML and write XPath rules with ==, !=, contains or exists, such as //status == ok; a body that is not valid XML fails. Choose None (status code only) when the body does not matter. Body must match regex adds a regular expression that must match the response body (anchor it with ^ and $ to test the whole body), and the Keyword card lets you require or forbid a word anywhere in the response.
What to assert, and what not to
Good assertions check things that must always be true when the API works:
- the overall status field and each critical dependency;
- that required fields exist and have the right shape (
data.items.0.id exists); - business limits that signal trouble, such as a queue depth or an error count above a threshold;
- the major version, so a breaking deployment is caught.
Avoid asserting on values that change normally: timestamps, request IDs, exact counts that grow every day. A rule that fails on a normal response is a false alert waiting to happen; our guide on how to reduce false alerts covers this and other tuning.
Beyond the body: headers and speed
- Expected response headers: one
Name: valueper line; the header must contain the value.Content-Type: application/jsoncatches a proxy answering with HTML. - Max response time (ms): a slower answer counts as Down. Useful for APIs with a latency promise; leave headroom for normal peaks. For the trends behind it, see response time monitoring.
- Watch the SSL certificate of this URL too: in the Certificate card, warns before the API's certificate expires.
Every result keeps the status code, the response time and its timings, and the error message, so the monitor page shows exactly which rule failed and when.
Reading a failed API check
Rules are evaluated from top to bottom, and the first one that fails becomes the error message of the result. The messages are written to be read at a glance on a phone:
| Rule | Example message |
|---|---|
checks.database == ok | checks.database is "down", expected "ok" |
checks.queue.depth < 1000 | checks.queue.depth is 4200, expected < 1000 |
error !exists | error should not exist |
data.id exists | data.id is missing |
| Response format JSON | Response is not valid JSON |
Because the message names the failing field, put your most telling rules first. A rule on the database field tells the person on call far more than a generic status == ok that fails for every reason at once. The same message appears in the alert, in the incident and in the Latest results list on the monitor page.
When one request is not enough
An API monitor checks one request. If you need to log in, keep a token and then call a second endpoint with it, use a Transaction monitor, which runs several steps, asserts each one and carries values from step to step. It is described in the synthetic monitoring documentation, and our guide to synthetic transaction monitoring shows when to use it.
Your monitors can also be managed from code: the REST API creates, updates and lists monitors with the same fields as the form. See the API documentation.
Frequently asked questions
What is the difference between API monitoring and uptime monitoring?
Uptime monitoring checks that an endpoint answers with an acceptable status code. API monitoring also sends the right method, headers, authentication and body, and validates the response content with rules.
Can I monitor an API that needs authentication?
Yes. The API monitor supports a bearer token, an API key header and basic auth, and any extra request headers you need.
What happens if the response is not valid JSON?
With the response format set to JSON, a body that cannot be parsed fails the check, which catches HTML error pages from gateways and proxies.
How often should an API health check run?
For customer-facing APIs, every one to five minutes is common; the shortest interval depends on your plan. See the pricing page.
Catch broken responses, not just broken servers
Point an API monitor at your health check, add a few JSON assertions and get alerted the moment the answer is wrong.