
A status page for SaaS is a public page that shows whether each part of your service is working, the uptime history of those parts, and the updates you post during incidents and maintenance. The best ones are driven by real monitoring, so they change on their own when something breaks, and let customers subscribe to updates instead of opening support tickets.
Key takeaways
- During an outage, a status page answers "is it just me?" for every customer at once.
- Components should match how customers think about your product, not how your servers are named.
- Status that comes from monitors stays honest; status that waits for someone to update it is always late.
- E-mail subscribers hear about incident updates without checking the page.
- Your own domain, logo and colours make the page feel like part of your product.
Why a SaaS product needs a status page
When your app slows down or fails, customers ask the same three questions: is it broken for everyone, are you aware, and when will it be fixed? Without a status page, each of them opens a ticket, tweets or e-mails your account manager, and your support team answers the same question dozens of times while the engineers are trying to fix the problem.
A public status page answers those questions once. It also matters between incidents: prospects check it during evaluations, and a long, visible uptime history is quiet proof that you take reliability seriously. For B2B products it is also the natural place to point to when a contract mentions availability.
What a SaaS status page should show
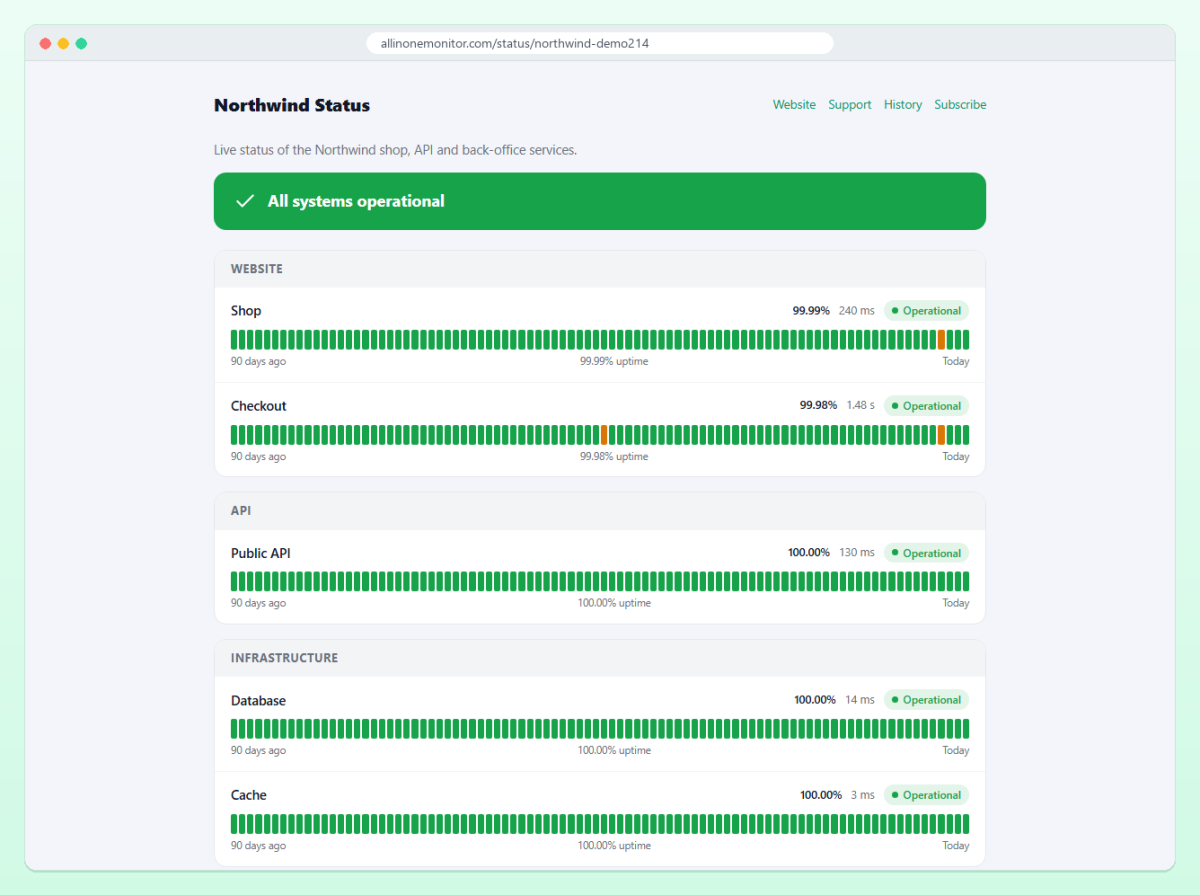
An overall state at the top
Visitors should know within a second whether there is a problem. In AllInOneMonitor the header shows one of four states: Operational, Degraded, Down or Maintenance. Any component that is down makes the page Down; otherwise any degraded component makes it Degraded; an active maintenance window shown on the page makes it Maintenance.
Components that match your product
Customers do not care about "web-02" or "redis-cache-1". They care about "Dashboard", "API", "Login", "E-mail notifications" and "Payments". Each component on the page takes its state from a monitor or a server, but you give it the display name, an optional description and a group, so the technical structure stays behind the scenes.
Uptime history
Uptime bars per component, with 30, 60 or 90 days of history, show patterns that one green dot cannot. Response-time charts are optional; turn them on if speed is part of your promise.
Incidents and maintenance
The page lists the incidents of its components with their public updates, open ones first, plus incidents you report by hand. Planned maintenance windows can appear ahead of time and while they are active.
Build the page step by step
- Create monitors for the parts of your product you want to show: the app, the API health endpoint, the login page, the marketing site. Our website uptime monitoring guide covers the basics.
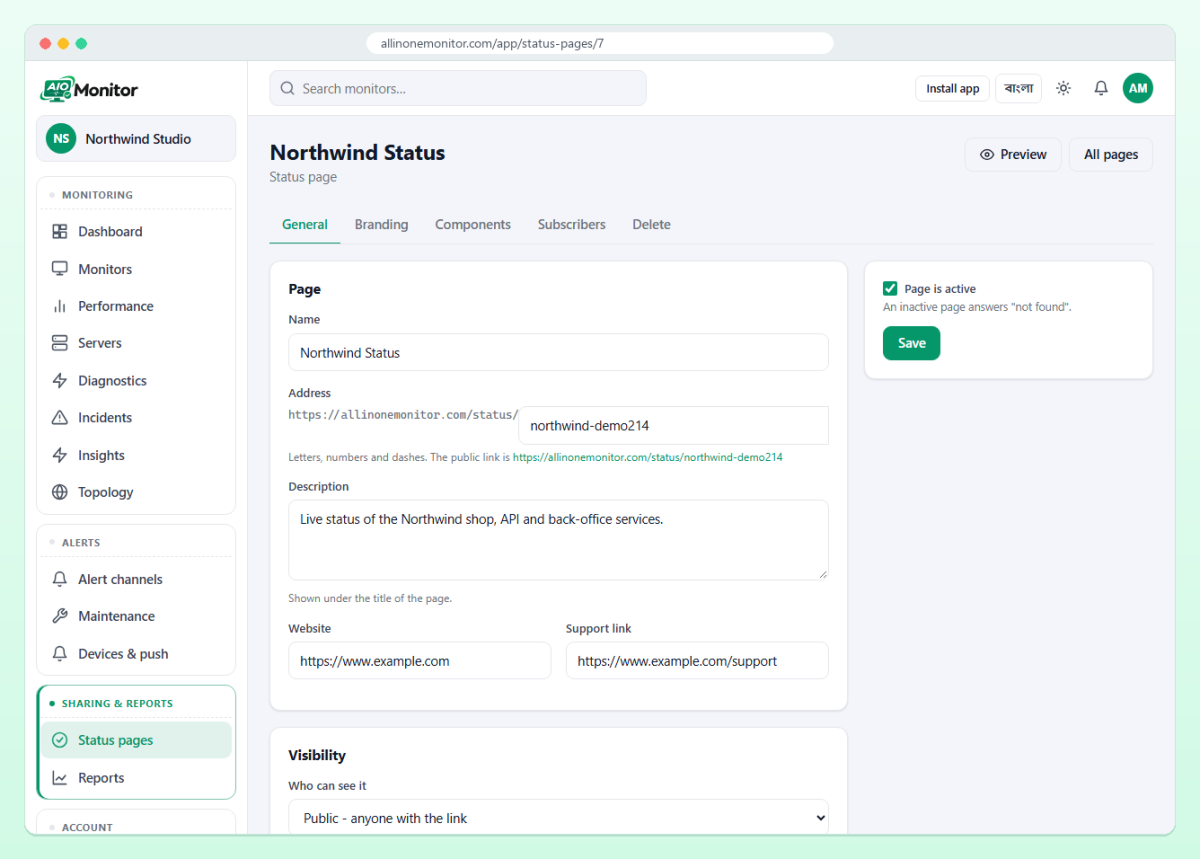
- Open Status pages. In the New status page card enter a name and click Create. The address is made from the name, at
/status/<slug>, and you can change it afterwards. - On the General tab, add a Description, your Website and Support link, choose the Visibility, and under What to show tick uptime bars, incident history and, if you like, response time charts. Pick the History shown.
- Tick Let visitors subscribe to e-mail updates.
- On the Components tab, use Add component: pick a monitor or server, give it a customer-friendly name and a group such as "Core services". Lower order numbers come first; click Save order & groups when you rearrange them.
- On the Branding tab, upload a logo and favicon, set the accent colour and the theme (light, dark or follow the visitor), and add a meta title and description for search engines.
- Open the public link, check it on a phone, and share it.
Public, private or password protected
Visibility has three options: Public - anyone with the link, Private - signed-in members of this organisation only, and Password protected, where visitors type a password you set once. A private page is useful as an internal dashboard; a password-protected one suits a status page for a single enterprise customer.
Status page subscribers
Subscribers are the most underrated feature of a status page. With subscriptions on, a visitor enters an e-mail address under Get notified, confirms it through a link, and from then on receives an e-mail for every public incident update that concerns the page, each with an unsubscribe link.
The Subscribers tab of the editor lists every address as verified or unverified, lets you remove one and offers Export CSV. Confirmation is required, so nobody can sign up someone else's address.
Tip: Put the subscribe link in your app's help menu and in onboarding e-mails. Customers who subscribed before an outage do not need to look for you during one.
Running incidents on the page
When a monitor behind a component goes down, an incident opens automatically and the component turns red, with no human in the loop. What the automation cannot do is explain. For that, open the incident and post updates with a status: Investigating, Identified, Monitoring and Resolved. Each update can be public (shown on the page and e-mailed to subscribers) or internal.
For problems no monitor can see, such as a third-party outage or a bug that affects one feature, use Incidents and Report incident. A manual incident that is not tied to a monitor still appears on your status pages. The incidents documentation describes the workflow, and our incident communication guide covers what to write.
Planned work belongs in Maintenance. With Show on status pages ticked, a window appears as upcoming before it starts and active while it runs, and alerts for the covered monitors are held back. See maintenance windows for the details.
A custom domain status page
A page at status.yourproduct.com looks like part of your product and is easy to remember. On plans that include custom domains:
- At your DNS provider, add a CNAME record for
statuspointing at the host name shown in the editor. - Enter
status.yourproduct.comin the Custom domain field on the Branding tab and save. - The certificate for that name is set up on the platform's side; once the CNAME resolves and HTTPS is in place, every link the platform generates for the page, including subscription e-mails, uses your domain.
Plans with white label can also hide the "powered by" line. Which plans include these options is listed on the pricing page, and the full setup is in the status pages documentation.
Embed a status badge in your app or docs
For a single monitor you can also publish a small badge or card. Turn on Enable public page on the monitor's page, and its settings card shows ready-to-copy snippets:
- Status badge: an SVG image with the status and uptime, ideal for a README or a docs footer.
- Embed: an iframe card with status, response time and the uptime bar.
- Public page: a standalone page for that monitor, with no details of the request.
Keep it honest
- Let monitors drive the components. A page that only turns red when someone remembers to update it trains customers not to trust it.
- Post the first public update quickly, even if it only says you are investigating.
- Do not hide components after a bad month. Uptime history is only credible if it includes the bad days.
- Close every incident with a short summary of the cause and what changes.
Frequently asked questions
Should a SaaS status page be public?
For most products, yes: it reduces support load during outages and builds trust between them. If you serve a few large customers, a password-protected or private page is an alternative.
Can I host the status page on my own domain?
Yes, on plans that include custom domains. Add a CNAME record for a name such as status.yourproduct.com and enter it in the page's Custom domain field.
What do subscribers receive?
An e-mail for every public incident update that concerns the page, after confirming their address. Internal updates are never sent.
Can one status page show servers as well as monitors?
Yes. Components can be monitors or servers; a server component is operational while its agent reports and down when it goes offline.
Give customers one place to check
Turn your monitors into a branded status page with uptime history, incident updates and e-mail subscribers.